
Are you an aspiring data scientist interested to learn about data analysis in a real-life data science project? Do you want to know about the reason why pandas library is so popular and How it helps in the data analysis?
In this article, I am going to explain about the key benefit of using pandas. As well as I will using a use-case-driven approach to explain some key pandas functions, their implementation, and the outcome. References will also be provided to learn further about implementing data analysis using pandas.
Why do we need to use pandas in a Data Science Project? Pandas is fast and flexible, several data scientists prefer to use pandas due to the following benefits
Open-source with a huge community support
Easy to read data from different formats
Access to a range of functionalities that supports data manipulation with ease
Supports data cleaning and offers a range of solutions for handling missing data and other data issues
Easy to merge data from different sources
Many critical components of pandas are written in C or Cython which makes it very fast/efficient
If you are aspiring to become a data scientist and interested in learning data science using python then you must learn to use pandas as they are critical for data analysis. In any data science project, about 80% of the time would be spent on exploratory data analysis, and the key library behind it is Pandas. To learn pandas, refer to the below tutorial video series it covers all key pandas functionalities that would be used in the data injection and analysis phase of the data science project.
How are Pandas used in Data Science Projects?
In order to explain the key functionalities of the pandas library that are commonly used at different stages of a data science project, let me use a modified version of the Google search trend data. Please note this data has been modified to include some data defects so that it becomes easy to explain the functionalities of the pandas library. The data and the script used here can also be found here. Below is the snapshot of the data. As highlighted in the screenshot there are a number of issues in the dataset like
Missing Data (Highlighted in Green)
Long Column Name (Highlighted in Indigo)
Error Values in the Data (Highlighted in Red)
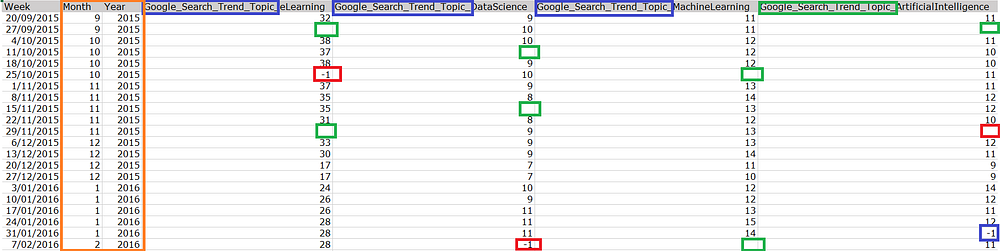
Also, we have month and year details available in a separate column which makes it easy for us to aggregate the data at the year or month level
Pandas is very useful right from reading the data which would be the very first step, it can be used to read data from different sources such as CSV, Excel, JSON, and SQL. The Series and Dataframe data structures of pandas makes data analysis easy and supports in a number of data manipulation and analysis. Here are some of the use-cases where pandas functions are very helpful
Data Cleaning and Manipulation
The data we work on a real-life data science project will not be perfect, it will, in fact, more likely to have a number of issues as mentioned in the screenshot above. Hence it would require a lot of cleaning and manipulation efforts to make it consumable and appropriate for our analysis and for our model.
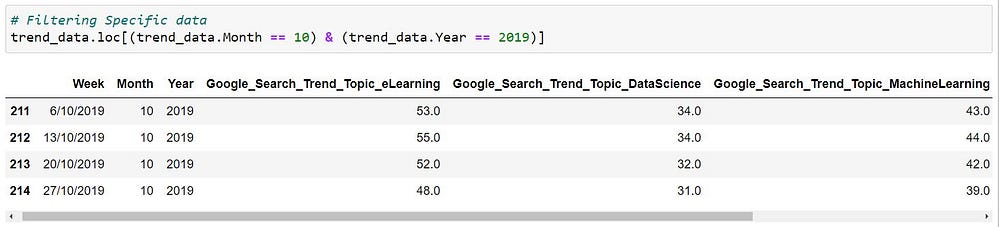
Filtering Data The first and foremost step of the data analysis should be to filter a subset of data to get a feel of the dataset that we are working on. In order to make the selection or filter certain column and rows in a data frame, the methods that can be used are
- Loc Method: This is a label-based method, we need to pass the label of the corresponding column and row for making the selection
- iLoc Method: This is an index-based method hence the index of the position need to be passed for making the selections
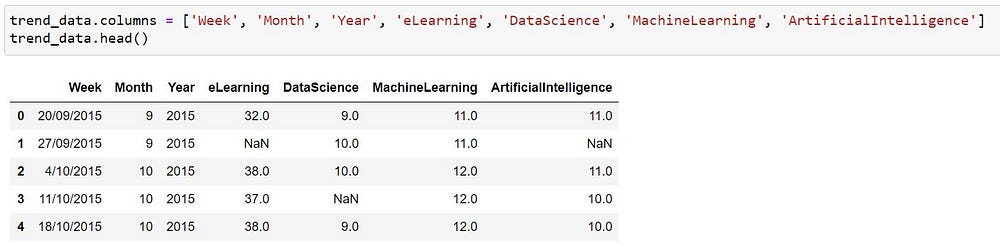
In the above scenario, we can see that the name of the column much longer than a desirable length, in most real-life projects as well the name of the columns/attributes could possibly include few metadata or prefixes hence it would be required for us to rename them into something that is intuitive and short. The names of the columns can be easily renamed in pandas like using the below method,
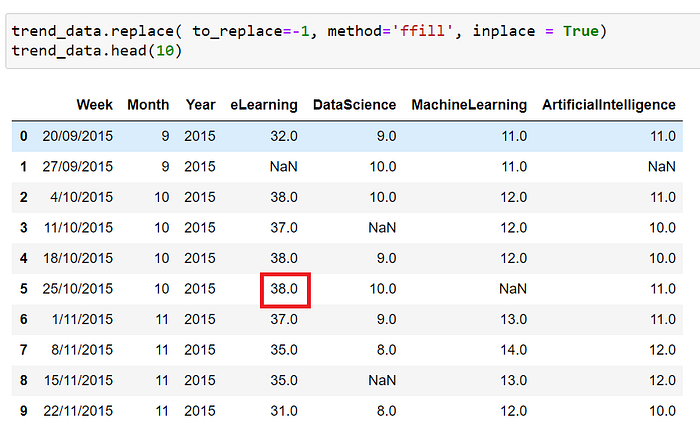
Replacing a Dummy/Default Value
There could be some values in the dataset that requires few updates like for example let us consider a sensor that sends the temperature data every hour but when there is an issue the system is configured to send code like ‘-1’ or ‘99’ which should be treated properly before being used for analysis. In our sample dataset as well we are having few values with ‘-1’ retaining these values as such could be an issue as these are numerical attributes and these default values if not handled properly could lead us to inaccurate analysis results, some of the popular methods that can be used to handle these defaults values are,
- Forward Fill
- Back Fill
- Replace with Mean
In the screenshot below the value highlighted in red was originally having the value ‘-1’ now replaced using the forward fill method hence picking up the value from the corresponding row before it.
Missing data and about handling them
The next common issue is the missing data, almost every data source will have some missing data and they need to handled properly to remove potential bias from the data. In order to identify the missing data and properly handle them, we can make use of the following functions in pandas
- IsNull — To identify the missing values
- fillna — To fill the missing values using a suitable method
- dropna — To drop the rows with missing values
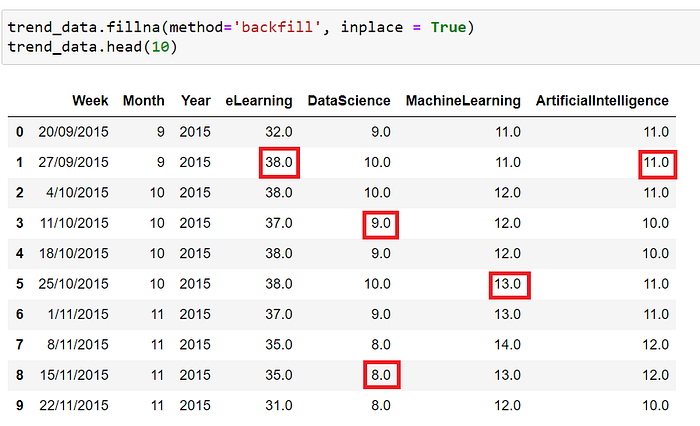
In the below screenshot we are using the function ‘fillna’ and backfill method to replace the missing values, the values highlighted in red were originally missing but now replaced using the backfill method. There are a number of methods that can be used to handle the missing values like, We can consider the month/year when the data is missing then replace it with a mean value matching to its corresponding period instead of using the column mean
- If the number of missing values are very less than we can consider removing them altogether from the analysis
- We can look for the missing data in a different source and if found then maybe they can be replaced depending upon the scenario the best approach can be identified
depending upon the scenario the best approach can be identified
Data Consolidation and Transformations
There are a number of functions/methods that help in data transformation and analysis. Let me explain them with use-cases,
Merging data from different sources
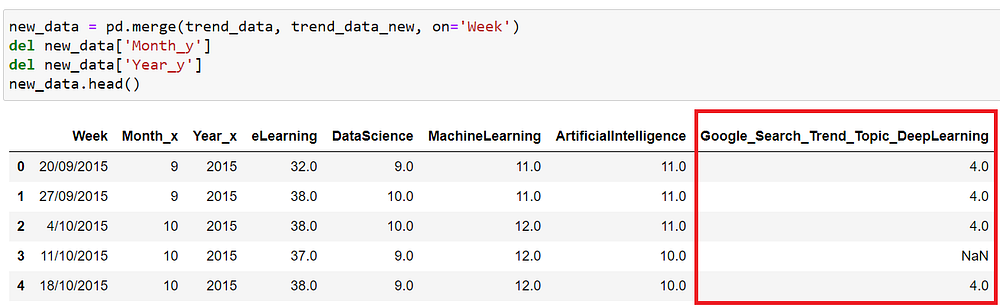
Data would generally come from multiple sources, for example, if we consider customer churn analysis as an example we would need customer-related data from their CRM system, interactions happened with the customer which normally resides in a customer support system, also there could possibly be some third-party data source like average spending by postcodes. In those cases, we would need to combine them and pick the relevant information for our analysis. The techniques that would be helpful here to join different datasets are “Combine, Merge, and Join”. Below is a simple example where the highlighted data coming from a different data frame is merged with our original dataset based on the common column ‘Week’ using the merge functionality of pandas
Grouping data and performing Aggregations
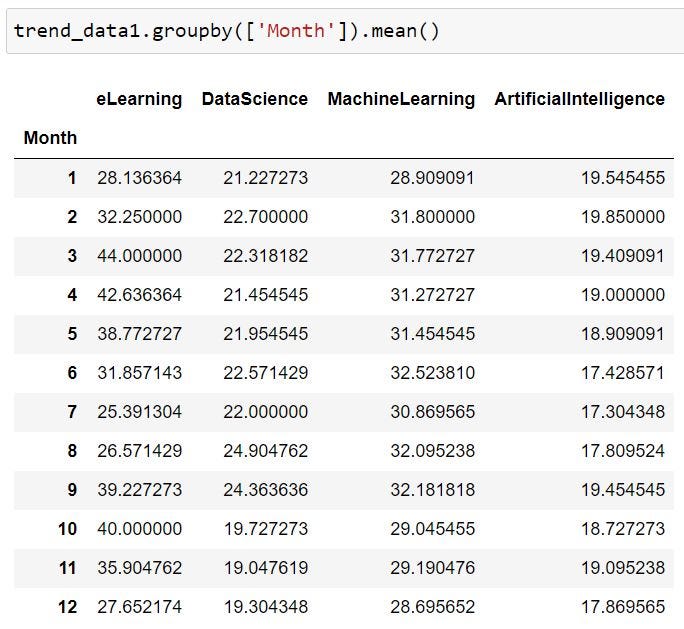
“Aggregation and Group By” are commonly used to extract patterns from the data. Like, in the below example we are getting the mean trend score of the topics by the month of the year. The dataset we had was weekly and it had the trend score for about 5 years now this functionality helps us to look for trends or seasonality in our dataset. There is a possibility that the score for certain topics peaks at a certain time in a year as compared to others.
Analyzing the relationship between attributes

Pandas offer many functionalities that enable easy and fast data analysis. Some of the common functions that help analysis are
Summary— helps in getting a high-level view of the dataset. There is a default summary method in pandas that helps in providing a specific set of insights about the data. The metrics produced would be different to numerical vs object/string columns
Crosstab and Pivot — These are additional tools in pandas for getting a better understanding of the data and used to get the relationship between 2 or more variables in the dataset. The crosstab and Pivot function would look very similar the key difference is pivot work only on a data frame whereas it is not the case the crosstab, but the catch here is crosstab would convert the input into data frame format and then call the pivot function. So when you have an input that is in data frame format just directly use pivot
Correlation — To understand how strongly a variable in the dataset is related to another variable in the same dataset. A strong positive correlation would mean that an increase in one value of one variable would also increase the value of the other variable in case of negative correlation an increase in the value of one variable would result in a decrease in the value of the other variable
There a number of other functionalities in pandas that help in better understanding the data, this really plays an important role in the model building because before finalizing the variable to be used in the model we need to be sure about the relationship between them having many highly correlated variables/attributes in the model could weaken the model performance.
Visualization
The most important part of a Data Science project is the communication of the insights or the results to the stakeholders and visualization plays a key role in making a flawless reporting. Pandas as such don’t have any visualization capability but it acts as a wrapper and uses the MatPlotlib in order to plot.
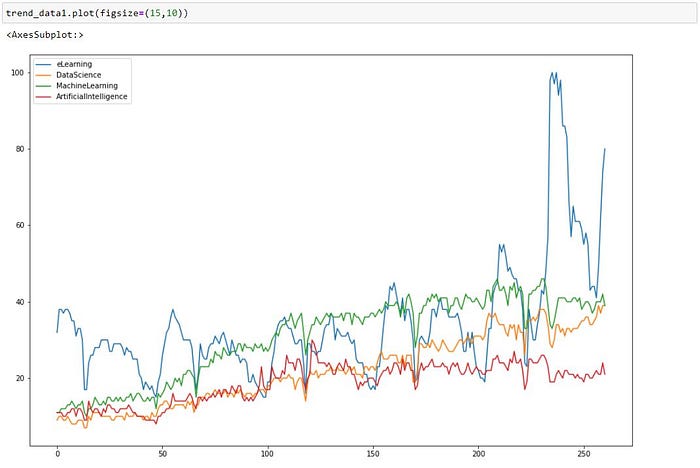
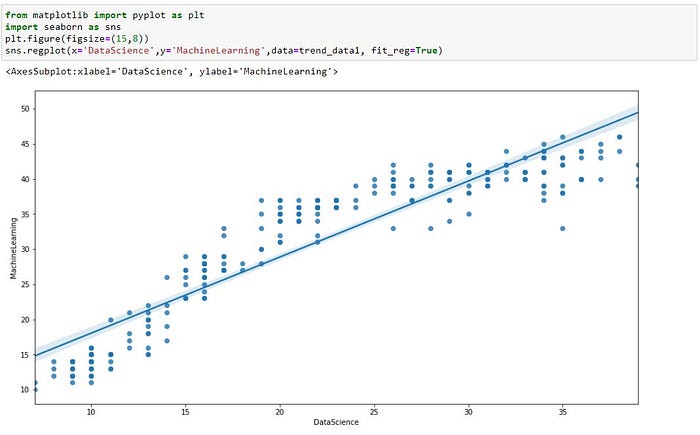
In addition, visualization helps to bring out the patterns in the data which otherwise would not be clear. For example, the below visualization shows the relationship between the score for the topic Data Science and Machine Learning but directly looking into the raw number the patterns might not be clear but from the below chart it is very clear that they are highly correlated to each other. (Note the below chart is based on Seaborn and not just Pandas, I am using it to show the importance of visualization in bringing out the patterns)
There are a variety of charts, a good visual can convey information that generally takes several lines if chosen to be communicated in written format hence depending upon the scenario the most suitable one can be used. Some of the common graphs/charts used are,
- Trend Chart: They are suitable when we have time-series data and would want to see the trend in the data
- Box Plot: This will be helpful in bringing out the distribution of a particular attribute(s) in our dataset and would also uncover the outliers in the data
- Bar Chart: Useful when we want to compare different attributes across a specific dimension
- Pie Chart: To understand the break-down in attributes like understanding the expenses in details based on their category
How do I learn Pandas?
If you are interested in learning pandas please check the below video it is a tutorial video series that covers all the important concepts and functionalities of pandas and their implementation. In total it has 10 modules each approximately 20 mins and the total tutorial length is just over 3 hours.
How long would it take to master data analysis?
Data Analysis is a skill that improves with experience and practice. Based on my experience, it is better to spend a few days and learn about the concepts and keep practicing with sample public dataset until you are comfortable with all the different techniques and methods, in a couple of weeks you would be able to master this skill.
About me
I am a Data Science professional with over 10 years of experience and I have authored 2 books in data science, they are available for sale here. I have a YouTube channel where I teach and talk about various data science concepts. If interested, subscribe to my channel below.