
As I am a fan of HBR, I am gonna work on finding the frequency of an HBR Article here.
To keep it simplified, I haven’t used any efficiency in the code. Feel free to optimize the code wherever it’s possible.
For a sample, we have chosen the article below:
Learning to Live with Complexity (opens new window)
To simplify the process, I have saved the article content in the text file (article1.txt).
Get the content from the text:
content = ''
with open(filename, encoding="utf8") as f:
     for line in f:
     content = content + line.lower()
The above code will get the content of the file (article text in our case). I have used a simple file open and string concatenation method here.
Word Tokenize:
The word_tokenize method will get the word as tokens
tokens = word_tokenize(content)
The above code will get the tokens from the content. It may have stop words and other unnecessary words which we don’t need. We will clean them up soon.
Token Clean up Process:
clean_tokens = []
stop_words = stopwords.words('english')
for token in tokens:
    # ignore string less than 4 characters
    if(len(token) < 4):
        continue
    if(token in stopwords.words('english')):
        continue
    token = porter_stemmer.stem(token)

    clean_tokens.append(token)
At first, we have removed the token who has less than 4 characters as they are not necessary. Then we have checked for stop words. If the token has stop words, we ignore them as well.
Finally, we have stemmed by using PoterStemmer.
What is PorterStemmer?
PorterStemmer will help us to get the root word for all words. For “keep, keeping and kept”, it will return “keep”
We can use PorterStemmber like below:
from nltk.stem import PorterStemmer
porter_stemmer = PorterStemmer()
token = porter_stemmer.stem(token)
Frequency and Plot:
Once we get the clean tokens, it is time to find the frequency distribution. This can be done with FreqDist in NLTK like below:
freq = nltk.FreqDist(clean_tokens)
freq.plot(20, cumulative=False)
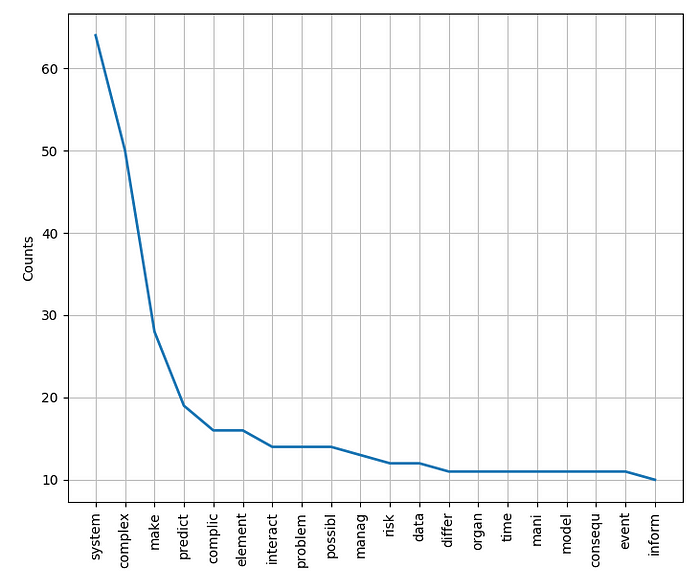
Results
It seems the words “system” and “complex” are used majorly comparing “event” or “inform”. This experiment is just a start. We can come up with many analysis by using NLTK!
Complete Code
import os
import nltk
from nltk.corpus import stopwords
from nltk.tokenize import word_tokenize
from nltk.stem import PorterStemmer

porter_stemmer = PorterStemmer()

def get_dir():
    dir_path = os.path.dirname(os.path.realpath(__file__))
    return dir_path

def get_frequency(filename):

    content = ''
    with open(filename, encoding="utf8") as f:
        for line in f:
            #print(line, end = '')
            content = content + line.lower()

    #print(content)

    tokens = word_tokenize(content)

    freq = nltk.FreqDist(tokens)

    clean_tokens = []

    stop_words = stopwords.words('english')

    for token in tokens:

        # ignore string less than 4 characters
        if(len(token) < 4):
            continue

        if(token in stopwords.words('english')):
            continue

        token = porter_stemmer.stem(token)

        clean_tokens.append(token)

    freq = nltk.FreqDist(clean_tokens)
    freq.plot(20, cumulative=False)


get_frequency(get_dir() + "/article1.txt")
Final Thoughts
We have used a very simple method to show the distribution. As this article is focusing on students and newcomers, we haven’t used any complex logic or lambda function.
If you have any questions/improvements/issues, please let me know. If you like the article, please hit the like icon.